Dashboards
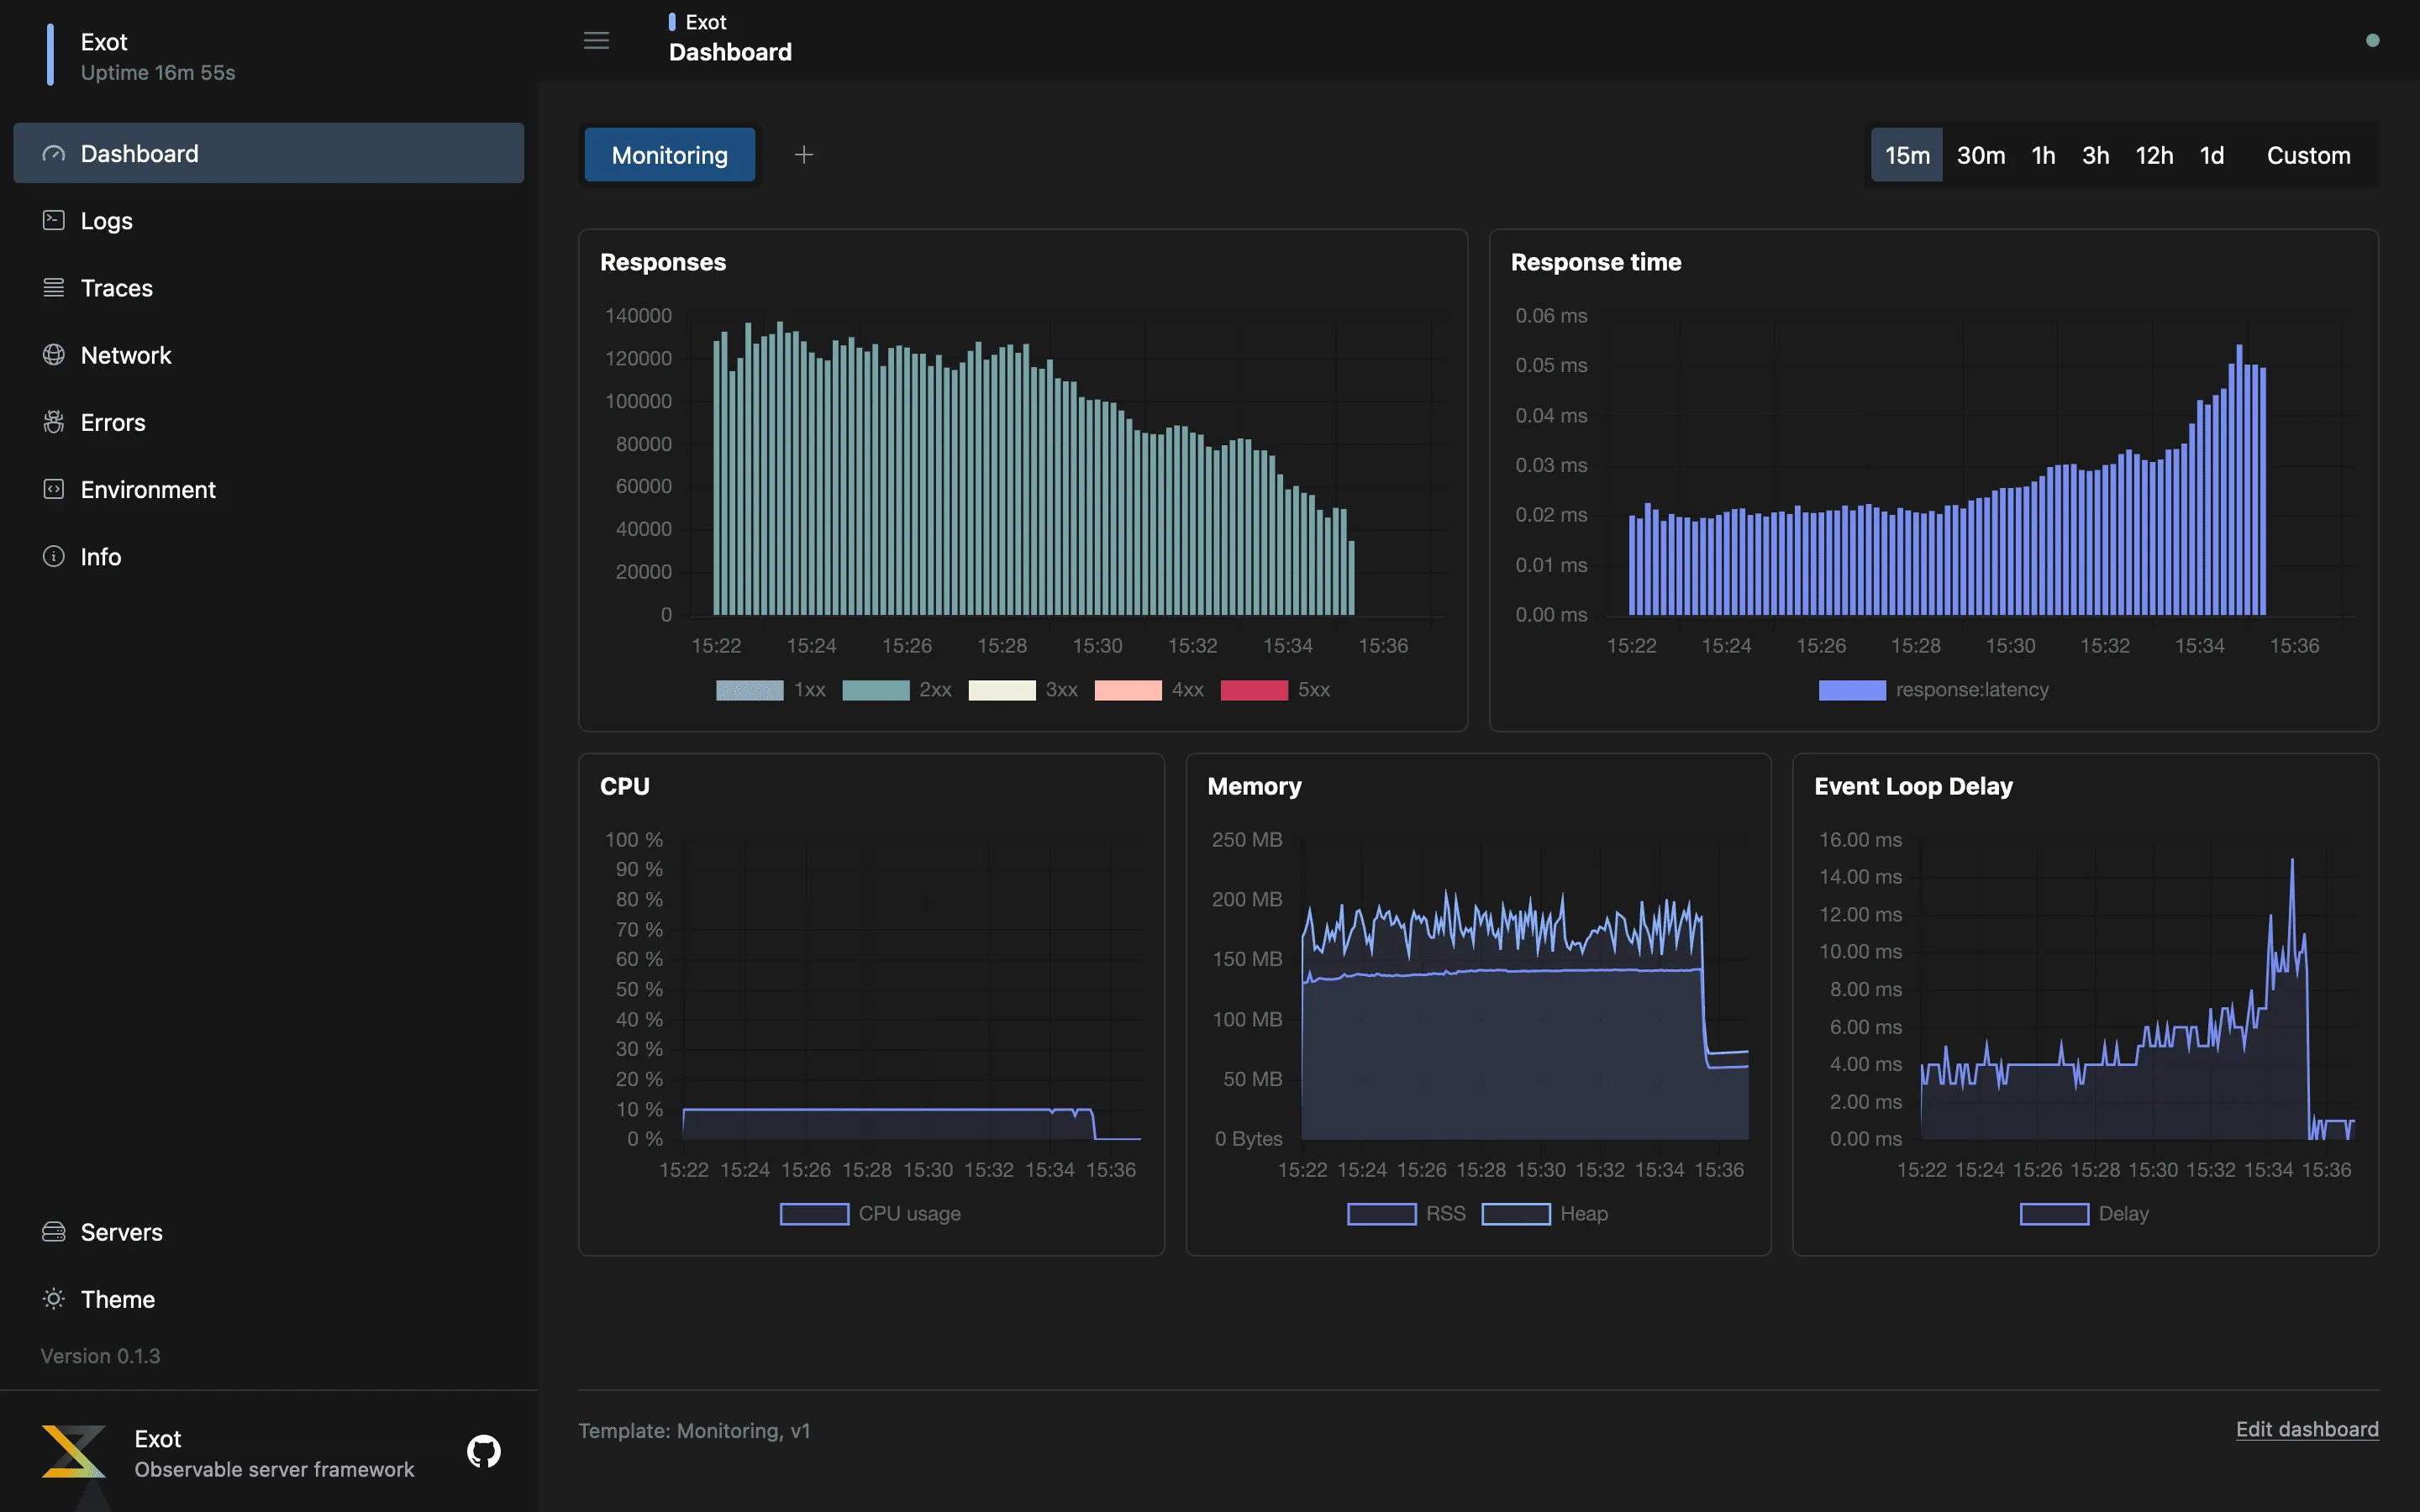
Dashboards visualize collected metrics using charts. By default, the Exot Inspector includes a monitoring dashboard that collects CPU usage, memory, event loop delay, and requests. You can also create your own custom dashboards.

Adding the Monitoring Dashboard
When you add a new server and connect to it, the Dashboards section won’t show any charts, but it will offer you the option to create a new dashboard for the server. The default Monitoring dashboard should be available on the screen as a template unless you have disabled it on the server. To add the Monitoring dashboard, click the button labeled Monitoring.
Modifying Dashboards
Dashboards are stored in the browser’s local storage, and the configuration can be modified without affecting other users.
To modify a dashboard, click the Edit dashboard button at the bottom of the page. In the dashboard modal, you can modify the JSON specification of the dashboard.