Instruments
The Exot Inspector offers a suite of powerful instruments designed to help you monitor, debug, and trace your application effectively. These instruments are easily accessible through the main menu located in the left sidebar.
Logs
Effortlessly collect, search, and inspect real-time application logs. Stay informed about your application’s activities and swiftly troubleshoot issues as they arise.
Learn more about utilizing logs on the server.
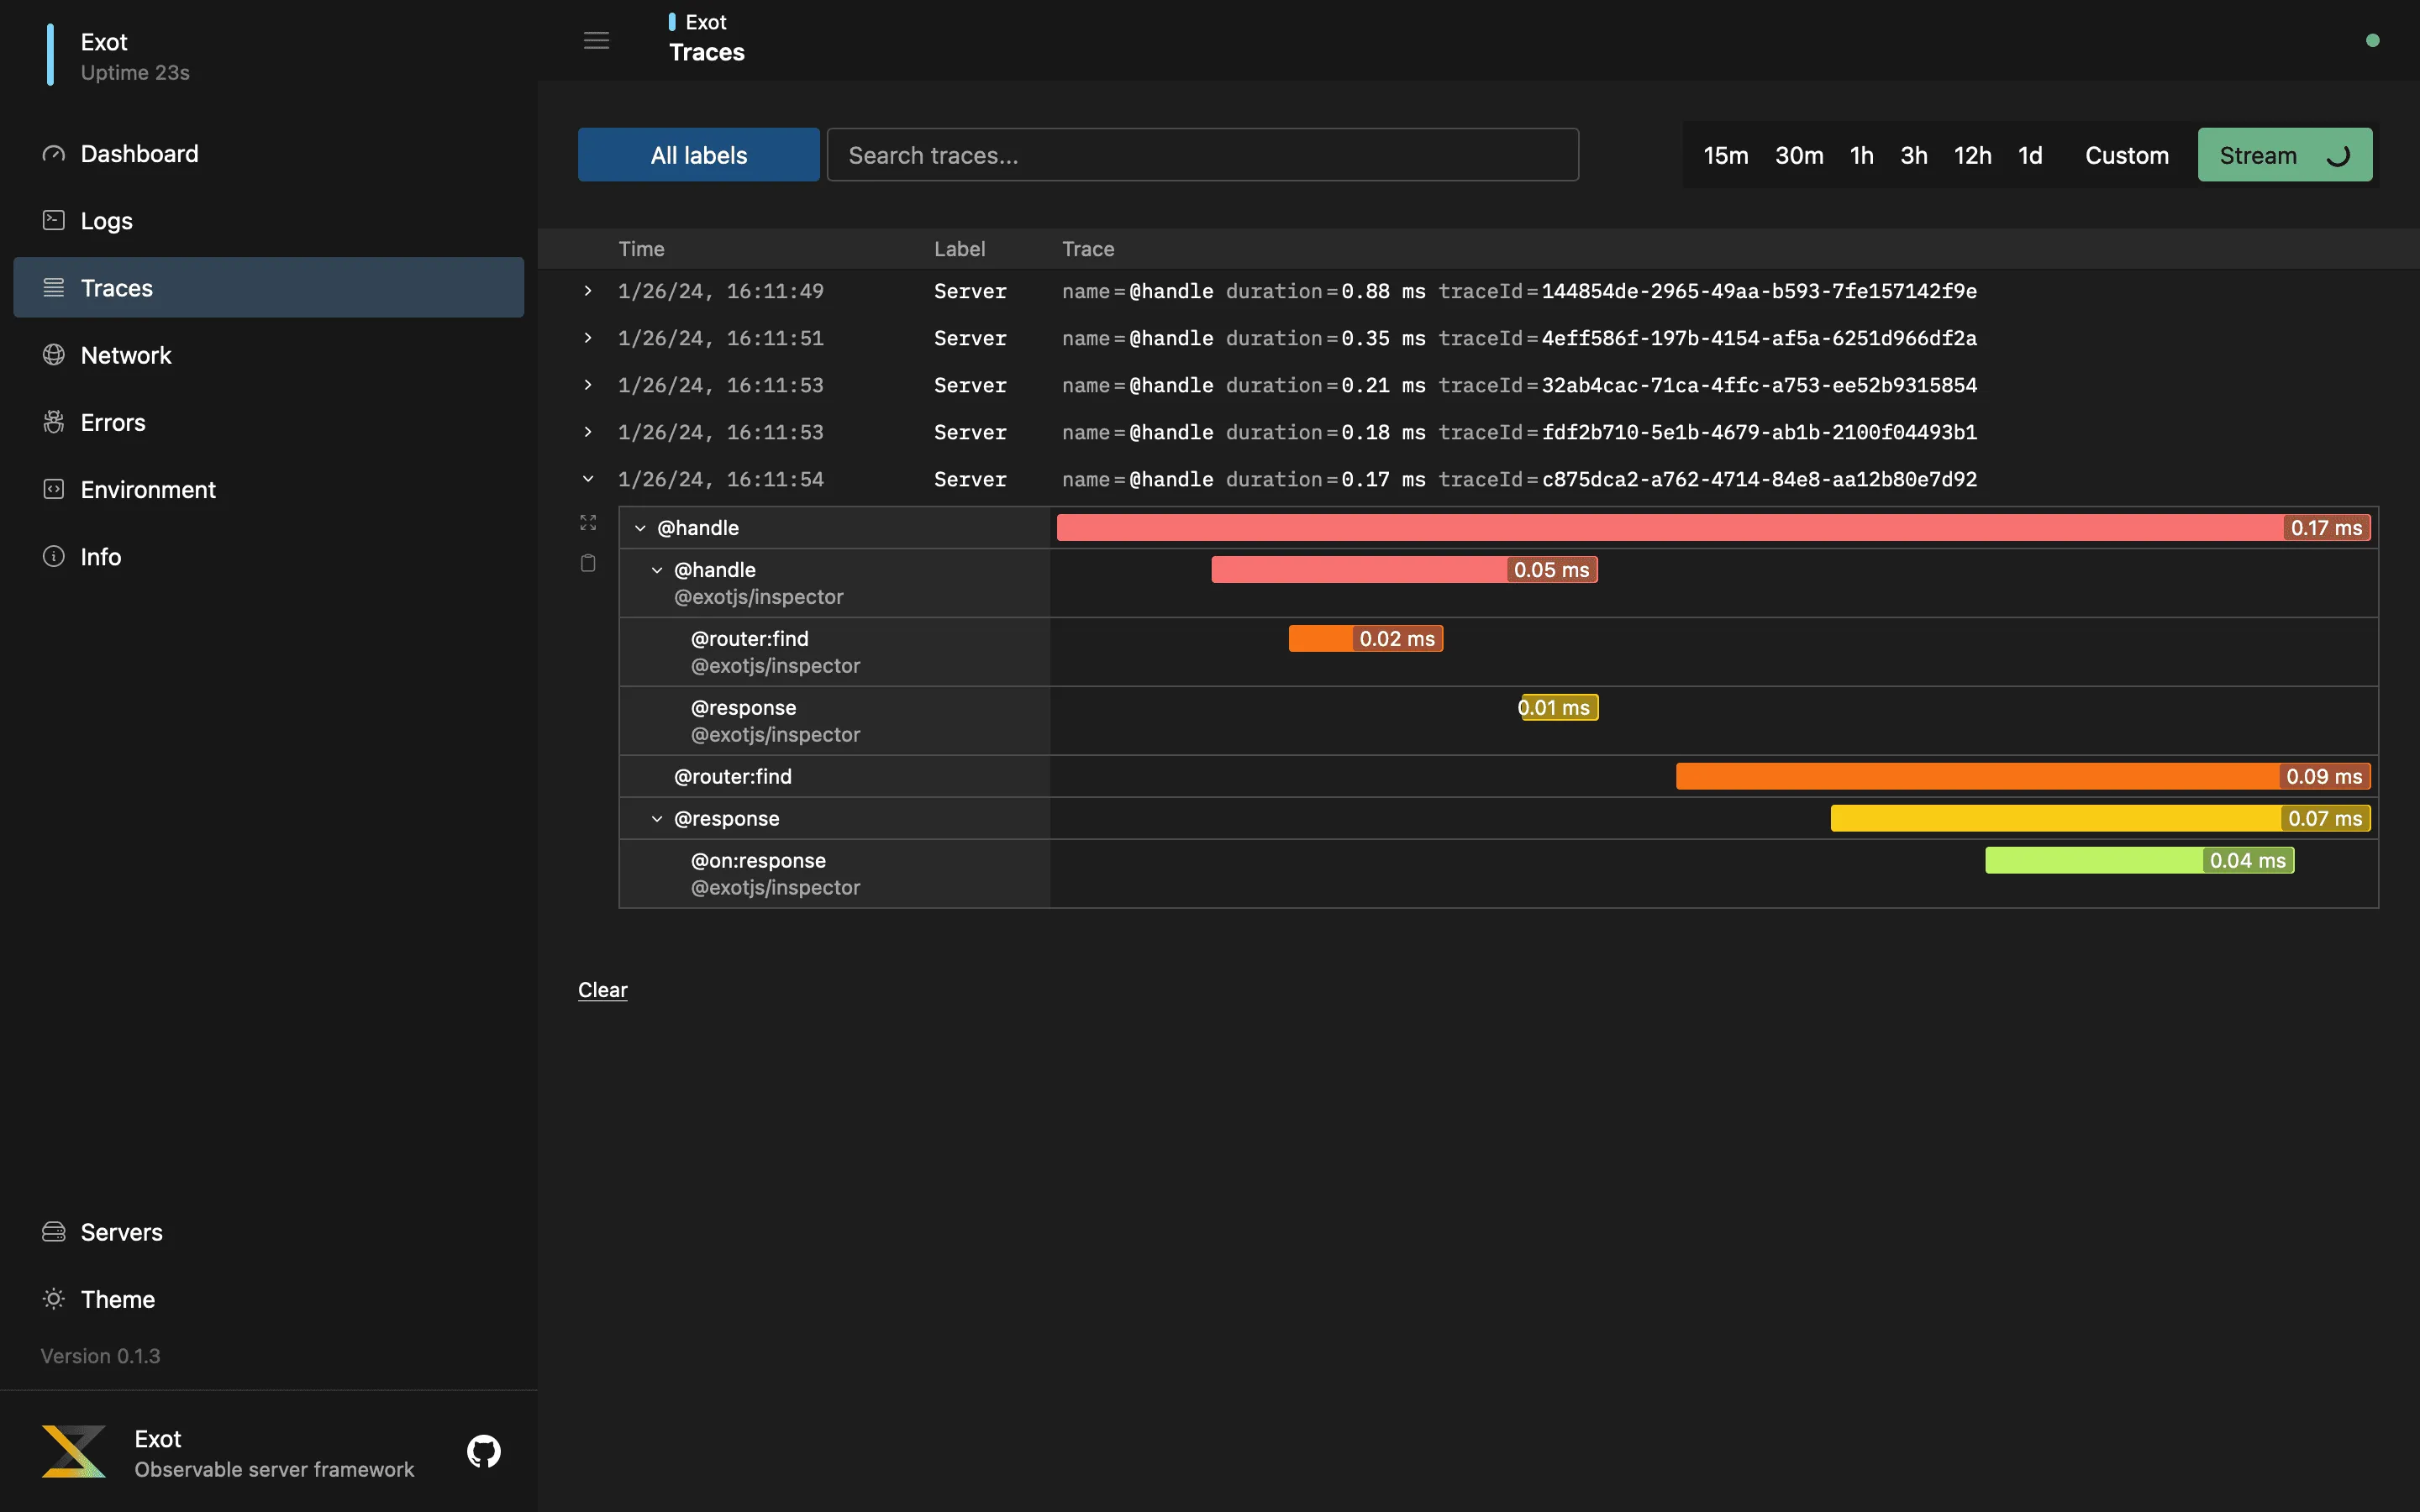
Traces
Gain detailed insights into your application’s performance through precise tracing capabilities. Identify bottlenecks and optimize performance and scalability by pinpointing areas that require attention.
Discover how to utilize traces on the server.

Network
Similar to Chrome’s DevConsole, the Exot Inspector empowers you to intercept outgoing HTTP requests and inspect them thoroughly. Compatible with both the built-in node:http module and fetch, this feature allows you to capture requests made by third-party packages and SDKs, providing enhanced control over network interactions.
Explore how to track requests on the server.
Errors
Efficiently capture and track application errors and exceptions with comprehensive information. Simplify the debugging process by accessing detailed error data through the Exot Inspector.
Learn how to capture errors on the server.
Environment
Inspect process environment variables to ensure your application is utilizing the correct variables and credentials. The Environment Inspector offers visibility into the configuration, facilitating the maintenance of your application’s environment integrity.
Server Info
Get insights into essential server information such as hostname, available memory, CPUs, and connected Exot Inspector clients (sessions).